
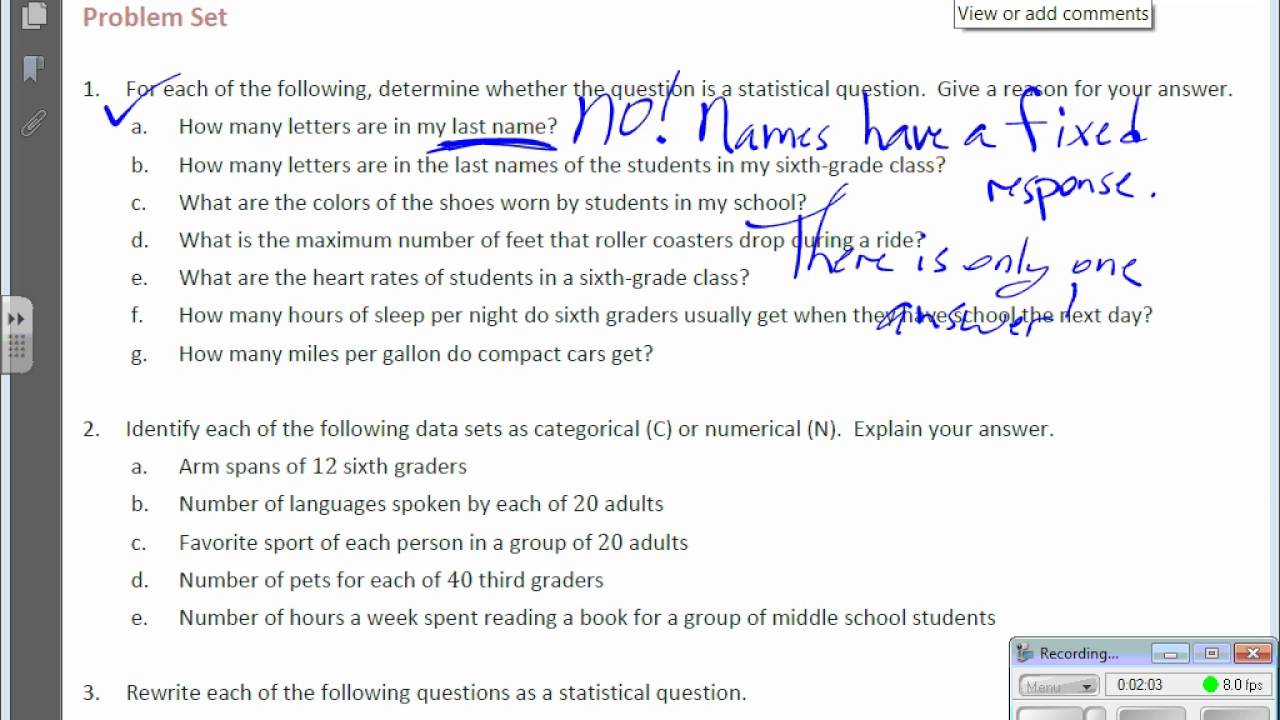
This video introduces the concept of statistical questions. What is a statistical question? Also, numerical and categorical data is defined.
Mungkin Anda Juga Suka
Year2 Maths
Year 11 Math
Year7 Maths
Year 9 Math
March 2024 KIDS Songs from LooLoo Kids
CoComelon | Netflix Jr
Happy Holidays from Netflix Jr!
Popular Compilations by CoComelon
PrePrimary Maths
KS2 Drama
Kids Songs by CoComelon
CoComelon
Year1 Maths
AR Videos
SSS10 Math
SSS12 Math
Year 10 Math
Year6 Maths
Year3 Maths
Year5 Maths
Mathematics Primary 2
Grade 7 Math Videos
Maths Grade 3
Maths Grade 1
Komentar
10 Komentar
This video discusses the mean (average) as a balancing point. Diagrams model how to find values that allow the balancing point to be maintained.
This video discusses the mean (average) as a balancing point. Diagrams model how to find values that allow the balancing point to be maintained.
This video shows how to find the center of distribution, also known as the mean or average. Visuals are used to find the values.
This video shows how to find the center of distribution, also known as the mean or average. Visuals are used to find the values.
This video shows how to find relative frequency values from a frequency table. Those values are also converted into percentages.
This video shows how to find relative frequency values from a frequency table. Those values are also converted into percentages.
This video discusses frequency tables with modules and then creates a histogram from the same data. Symmetrical, skewed left, and skewed right curves are introduced as well. (Sorry. I misspelled skewed on the video!)
This video discusses frequency tables with modules and then creates a histogram from the same data. Symmetrical, skewed left, and skewed right curves are introduced as well. (Sorry. I misspelled skewed on the video!)
This video shows how to build dot plots and frequency tables from a set of data.
This video shows how to build dot plots and frequency tables from a set of data.