
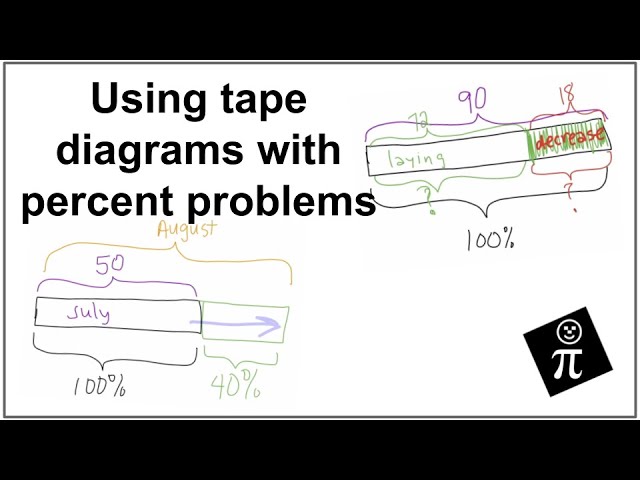
Tape diagrams are amazing! They help us visualize the math problem we are trying to solve. Once the situation is modeled, the arithmetic becomes pretty easy. #TapeDiagrams #TapeDiagramTuesday
Vous aimerez aussi
Year 8 Math
Year 9 Math
Cambridge Primary Mathematics Workbook 5
Matholia Primary 3
Numberblocks Special Moments ✨
Kids Songs by CoComelon
Learn Colors with CoComelon!
Year1 English
CoComelon
Alphabet (ABC) Songs by CoComelon
CocoMelon | Little Baby Bum | Blippi - Nursery Rhymes & Kids TV Shows
Learn English With Disney Movies
PrePrimary Maths
Year1 Maths
Year 11 Math
Year2 Maths
3rd Grade Math
3rd Grade Fractions
6th Grade Math
Numberblocks - Number Adventures | Learn to Count | Maths for Kids
Suites numériques 1Bac
Trigonometry 2: How Sine Helps Cosine - 5: Sine-Cosine Combo
Addition of Similar Fractions
Rounding & Math Adventures 🔢✨
Commentaires
10 commentaires
Use a tape diagram to convert a fraction to a percent. #math #TapeDiagram #TapeDiagramTuesday
Use a tape diagram to convert a fraction to a percent. #math #TapeDiagram #TapeDiagramTuesday
What is the new price for a shirt that normally costs $18.50, but is now on sale for 20% OFF? We use tape diagrams and tables to make sense of percent decrease problems.
What is the new price for a shirt that normally costs $18.50, but is now on sale for 20% OFF? We use tape diagrams and tables to make sense of percent decrease problems.
18.5 is increased by 20%. We use tape diagrams and tables to make sense of percent increase problems.
18.5 is increased by 20%. We use tape diagrams and tables to make sense of percent increase problems.
60% of 40 is what number? We use tape diagrams and tables to make sense of this problem.
60% of 40 is what number? We use tape diagrams and tables to make sense of this problem.
9 out of 15 is what percent? We will use a tape diagram and a table to make sense of this problem!
9 out of 15 is what percent? We will use a tape diagram and a table to make sense of this problem!